
No good options
We give the committee a lot of flack for its process, but the truth is, there is no perfect way to evaluate teams. The current way still stinks though.

It was hard, in this week’s version of the Anger Index, not to essentially rehash much last week’s edition because it seems as though the committee has basically decided that some teams are good, others are not, and the résumés aren’t really as important as the eye test.
For example, on Miami:
The Hurricanes’ metrics are solid. They’re 13th in SP+, 13th in strength of record, have four wins vs. FPI top-35 teams (i.e. the top 25% of FBS) -- more than anyone but Texas A&M and Alabama -- and, of course, have the same record as Notre Dame and hold the head-to-head victory over the Irish.
The committee, however, has Notre Dame ranked ninth and Miami 15th.
It’s nonsensical on its face, and worse when you consider the committee also has Texas (with a worse loss than either of Miami’s), Utah (just one FPI top-35 win) and Vanderbilt (four spots behind Miami in FPI) all ranked higher, too.
Or on BYU:
BYU and Oregon have the same record. BYU has a win over the committee’s No. 13 team, better than Oregon’s win over No. 21 Iowa (which is unranked in the AP poll, by the way). They both have understandable losses, but BYU’s was on the road.
And the committee sees BYU as four spots behind Oregon.
Make it make sense.
I didn’t include Georgia Tech here, but it’s worth noting that, when the committee saw fit to finally have Miami jump a team — it was a one-loss team from the ACC. Indeed, Georgia Tech is 8-1 and ranked below six two-loss teams.
Now, I’m not going to tell you that a one-loss team is always better than a two-loss team. Obviously, that’s not true. North Texas has one loss. USF has two. But one of USF’s two was against Miami. North Texas has played no one near that good. We cannot guarantee UNT would’ve lost to Miami, but it’s a fairly safe assumption. Beyond a reasonable doubt, let’s say.
Of course, “reasonable doubt” isn’t a flawless way to approach anything. Enough convictions are overturned each year to underscore that reasoned folks can improperly guess things from time to time. But in college football, so much comes down to guesswork and assumptions, which is why we try to rely on data the best we can. Which got me to thinking about the data we use and why no one statistic tells us everything.
Wins and losses
Strengths: Winning is, like, the whole point of sports.
Losses: Records don’t consider the quality of opponent played in a sport in which schedules vary wildly.
In every professional sport, the path to the postseason is simple: Win more games than everyone else. We never complained that the Patriots didn’t deserve the AFC’s top seed just because they also played in a division with the Jets, Dolphins and Bills. But in college football, you’re defined as much by the company you keep as the quality of your personnel. And, of course, all wins aren’t the same, as we showed with UNT and USF above1.
But wins and losses need to be factored first and foremost or we risk losing the thread on why we’re playing the games to begin with.
Head-to-head and common opponents
Strength: Actual on-field data points
Weakness: One-game sample sizes may not tell a full story; flukey things happen; home vs. road and various injuries can impact single-game outcomes
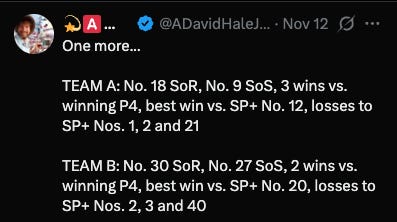
Miami beat Notre Dame. They have the same record. Notre Dame is ranked five spots higher.
That seems absurd, and I wrote about that again this week, after which I was reminded that Louisville has a head-to-head against Miami and is also five spots behind the Canes. But Louisville also trails Miami by a lot in other factors like strength or record and SP+ and has a much worse loss (to Cal) than Miami has.2
Georgia and Oklahoma both beat Tennessee in Knoxville by one possession. Should they each get roughly the same credit?
Well, with less than 5 minutes to play against Georgia, the Vols had a 91% chance to win. They lost.
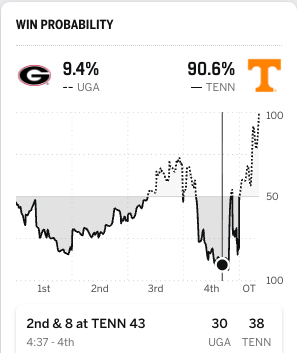
Against Oklahoma, at about the same point in the game, the Vols were cooked.
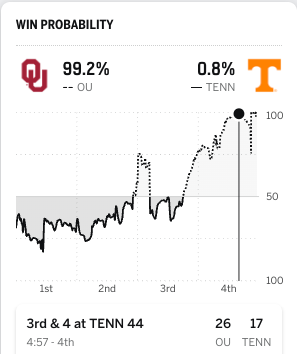
Georgia certainly deserves credit for the win, but does it deserve as much as Oklahoma does? That leads us to…
Game Control or Average Win Probability
What it is: A measure of how emphatically a team won or lost a game based on in-game situations
Strengths: Differentiates between a blowout (say, Indiana’s win over Illinois) or a close loss (like Indiana’s win over Iowa)
Weaknesses: Rewards running up the score; Doesn’t reflect that the most important part of the game to control is the scoreboard at the buzzer
Game Control became the most hated stat for Florida State fans back in 2014, when all this was new and the Noles were pulling out one late win after another — and being held back as a result. But clearly how you win a game matters some, right? Louisville’s loss to Virginia came in overtime after surrendering two defensive touchdowns. Miami’s loss to SMU came after the Canes blew a big lead and threw a costly pick in OT. Replay those situations 100 times and they won’t unfold the same way again. If the rankings are part beauty contest, this is the best way to score the bathing suit competition.
Strength of Record.
What it is: A measure of how likely it is an average top-25 team3 would have the same or better record against your schedule.
Strengths: I’ve written a bunch about how awful strength of schedule is as a metric — and Lane Kiffin agreed this week, noting that it is mostly good for getting coaches fired — but strength of record combines who you played with the outcome of that game.
Weaknesses: Still relies heavily on flawed SoS metrics; Doesn’t account for final score or how much a team controlled the game; Opponent strength may vary based on injuries, etc. throughout the season.
No metric more closely aligns with the committee’s actual rankings than SoR. Why is Louisville so low in the committee’s rankings? This is Exhibit A.
It’s a good metric, but it has flaws, too. Again, as I’ve noted — you don’t control your schedule. Louisville was supposed to play Indiana this year. Indiana backed out. Sorry, Louisville, your SoR just got a little worse!
And, it doesn’t account for how teams played in those games. Texas A&M’s win over Notre Dame off a botched PAT is viewed the same as Miami’s far more emphatic one.
It still uses iffy SoS metrics (seven of the eight hardest schedules played so far belong to SEC teams) and all wins are treated the same, regardless of whether, say, you beat Oklahoma with a healthy John Mateer or an injured one.
Advanced metrics
What they are: Metrics like SP+ and FPI and Sagarin and FEI that measure a team’s underlying quality while adjusting for things like luck (i.e. turnovers, field position, etc.), filtering out garbage time, and including depth of talent (like recruiting rankings and past history).
Strengths: They’re a better window into how good a team performed, regardless of the outcome of a game; They’re intended to be predictive, so they offer a solid measure of how hard it was to beat any specific team (i.e. a win over 3-6 Penn State is probably harder to accomplish than a win over 6-3 Minnesota, regardless of the records).
Weaknesses: They rely on recruiting rankings and preseason assumptions to varying degrees; They do not care about who wins or loses but only how a team performs; They are prone to the same SoS biases; They often provide head-scratching results like Penn State being the No. 20 team in the country; They are used entirely incorrectly by entirely too many people.
These stats are great at filtering out a lot of noise and offering insight into who’s better or worse than their record might suggest. This is good for judging how difficult a win (or how bad a loss) might really be. But as I’ve written here (with insight from the great Bill Connelly) stuff like SP+ is intended to be a forward-looking metric — a probability of who would win more often in a series of hypothetical future matchups, yet too often people use it as a measure of success or failure in past, real matchups.
SP+ is a great judge of the evening gown competition at the beauty pageant, but it can’t predict who’ll flub the question-and-answer part.
Ranked wins & the AP poll
Strength: A consensus of ostensibly educated football folks that allows humans to adjust for all kinds of context that goes unnoticed by the computers.
Weaknesses: We’re often bad at this (see: State, Penn), we are prone to our own biases and unlikely to have seriously watched every team; there is no real difference between the 24th-best team and the 28th-best, but we stop at 25 regardless.
Using ranked wins is bad, but it also creates some real controversy. For example:
Team A is Tennessee, who’s beaten no one but doesn’t have a bad loss. Team B is Arizona State, who has some good wins — including vs. Texas Tech — and some ugly losses due in large part to an injured QB. But because Tennessee is a “ranked” win, that’s good news for Georgia and Alabama. Arizona State being on the outside hurts Utah.
Or…
Team A here is Illinois. Team B is Iowa. Now, I can make the case that Iowa played some good teams much closer than Illinois did, but the choice to rank the Hawkeyes and not the Illini has a significant impact on a school like Oregon, who lacks any meaningful Ws except… Iowa.
The Eye Test
Strengths: Smart folks tend to be good at determining the most talented teams, and talent typically prevails when crowning a national champion.
Weaknesses: Talent doesn’t always win out; Rewarding the team that looks the best often alienates any program outside the blue bloods (and prohibits them from building); The best teams will make the playoff either way, but finding who should be the 10th, 11th or 12th team in is likely about determining who’s the best of a flawed bunch; Should we really be rewarding the most talented teams on that alone or the ones who rise to the occasion most often?
For all the other information we have at our disposal, I’m convinced this is the metric the committee cares about most.
The room is filled with coaches and ADs. They’re ball-knowers. They watch the game and decide who’s good based on what they see — even if the numbers don’t quite match their opinion. They’re not exactly the biggest fans of advanced math regardless. They like jocks, not nerds.

This is a reason I like doing the blind résumés. For example…
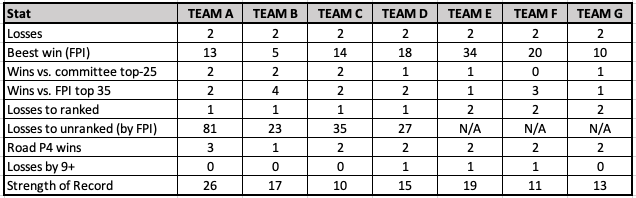
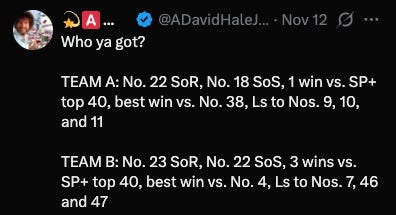
Looking at these two-loss teams, how would you rank them? (Note: Revealing who’s who in the footnotes.)4
Well, Team B has the best win.5 It has a ranked loss and another top-25 loss by FPI. It has the most good wins. Team C has the best strength of record but also a bad loss. Team A has won on the road but has a bad loss. Team E hasn’t really beaten anyone good. Team F has some good wins but none against currently ranked teams.
Me, personally: I’d probably go B, F, G, D, C, A, E.
What if I told you that Team G was ranked the highest? Or that Team E was seven spots ahead of Team A? I don’t think most folks would agree until you attach names to the numbers.
OK, so after all this, what have we learned?
The short answer is that everything sucks. There is no good metric.
The more complex answer is that, while there is no panacea, there is, if committee members chose to utilize them in a coherent, objective and consistent manner, enough data that, considered together, would reveal at least something of a reasonable playoff picture.
And this has always been my complaint about how the committee does business. They have all this data at their disposal, but they use it in an utterly ad hoc way. “We like Texas for this reason” and “Miami stinks for this reason” and those two reasons are as unique as snowflakes, applied as needed to rationalize a decision made for reasons we’ll never truly understand.
All science is an educated guess. We can’t know the future. But we trust science — or, we should anyway — when it’s done properly using a rigorous, defined process that can be repeated again and again by different, objective parties to reach more or less the same consensus.
If the committee had a process like that, it sure would be nice for them to share it. But they really don’t, which is why each new round of explanations is as frustrating as the last, and regardless of whether we end up with “the right” teams, it’s hard to ever trust how we got there.
This week on Inside ACCess
OK, that was a way-too-long post, so let’s go quick here…
I wrote earlier this week about the issues the ACC faces. I plan to go deeper on that in a story by the end of the year, and Andrea Adelson and I did some talking to folks and got some good feedback. But, for the show this week, we picked the brain of former Syracuse coach Dino Babers, and I thought he had some interesting takeaways.
Also, we chatted with UNC’s overnight superstar Melkart Abou Jaoude, who was scouted — no joke — while working at a bagel shop in high school. He was great.
Lastly, Andrea and I talked a good bit about Virginia on this week’s show, and I cannot encourage you enough to check out her terrific story on how Tony Elliott built this program against the backdrop of unimaginable tragedy.
Reminder: You can catch the full interviews plus our entire discussion on the Inside ACCess podcast HERE.
And, our Week 12(!) ACC picks…
This is also what we call “quality losses” which the committee seems to view as incredibly important unless you’re Texas. I HATE quality losses. I’m all for not punishing teams for losing to elite opposition, but the idea of rewarding anyone for a “good” loss is stupid.
It’s still insane to have Louisville five spots behind Miami and 10 spots behind a team Miami beat when they all have the same record.
How you define an “average top-25 team” is a bit nebulous, and if you were to instead ask about an “average playoff team” you’d get different results. There’s an inherent question about what makes for a tougher schedule — a bunch of games against good teams or a couple games against elite teams and the rest against bad ones. An elite team would rather the first option — they’ll beat good teams most of the time — whereas a above average team would probably prefer the latter, as they’re likely to lose to the two elite teams anyway, but will have better odds of maneuvering the rest of their schedule.
A = Louisville, B = Miami, C = Texas, D = USC, E = Utah, F = Vandy and G = Notre Dame.
“Beest win” is a typo. The extra B is for BYOBB.
IRT the committee's decision-making process:
"These are my principles -if you don't like 'em, I've got others."
-Groucho Marx